
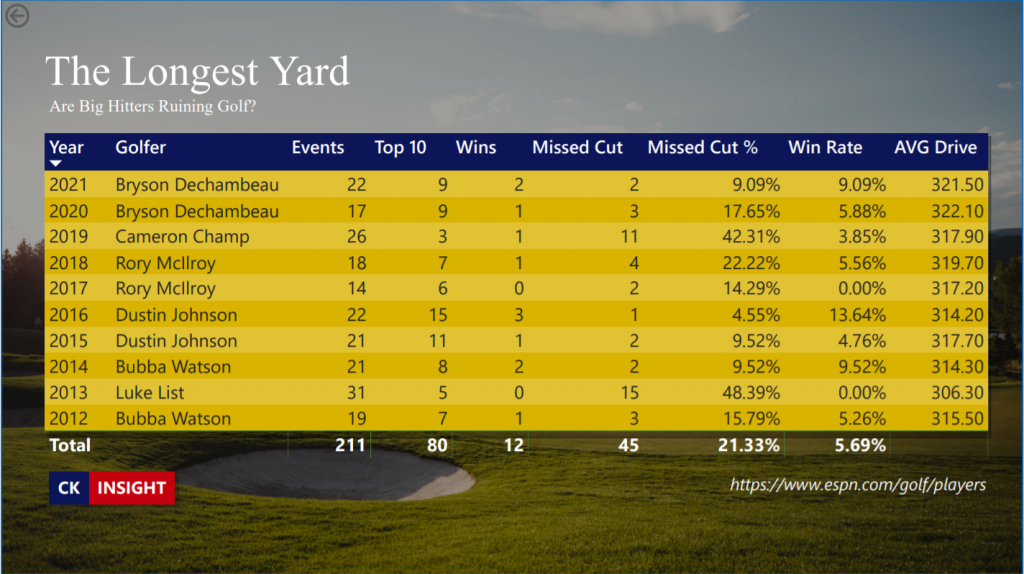
Over the last 10 years a total of 211 events were entered by the longest drivers of the year, out of this there were a total of 12 wins – That’s a 5.7% win rate, which is pretty low to be honest, although only one player can win any event.
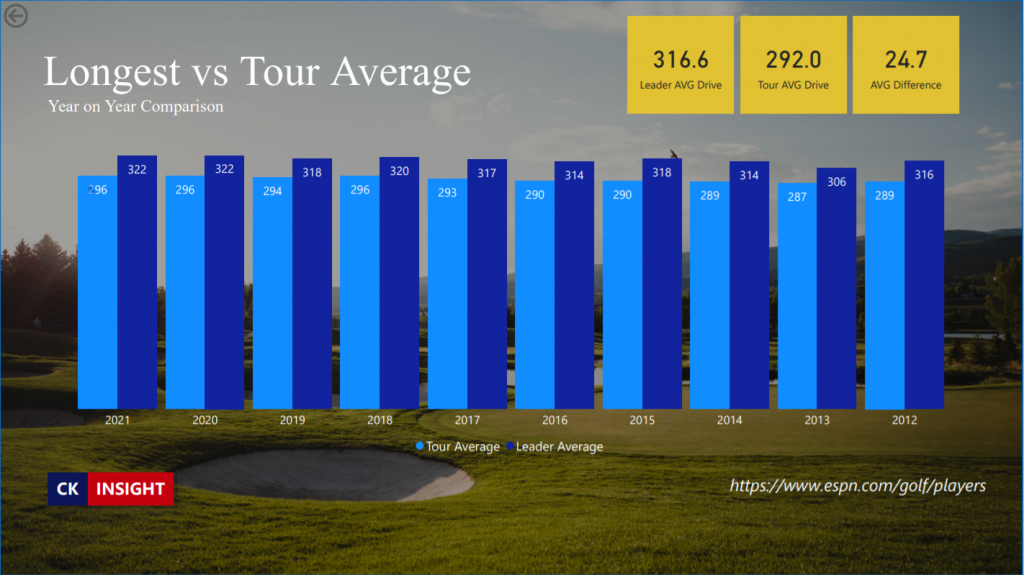
The average difference between the biggest hitter vs the rest of the field was 24.7 yards, the biggest difference was in 2015 – 28 Yards, this didn’t help DJ dominated the competition though.
The average difference between the biggest hitter vs the rest of the field was 24.7 yards, the biggest difference was in 2015 – 28 Yards, this didn’t help DJ dominated the competition though.
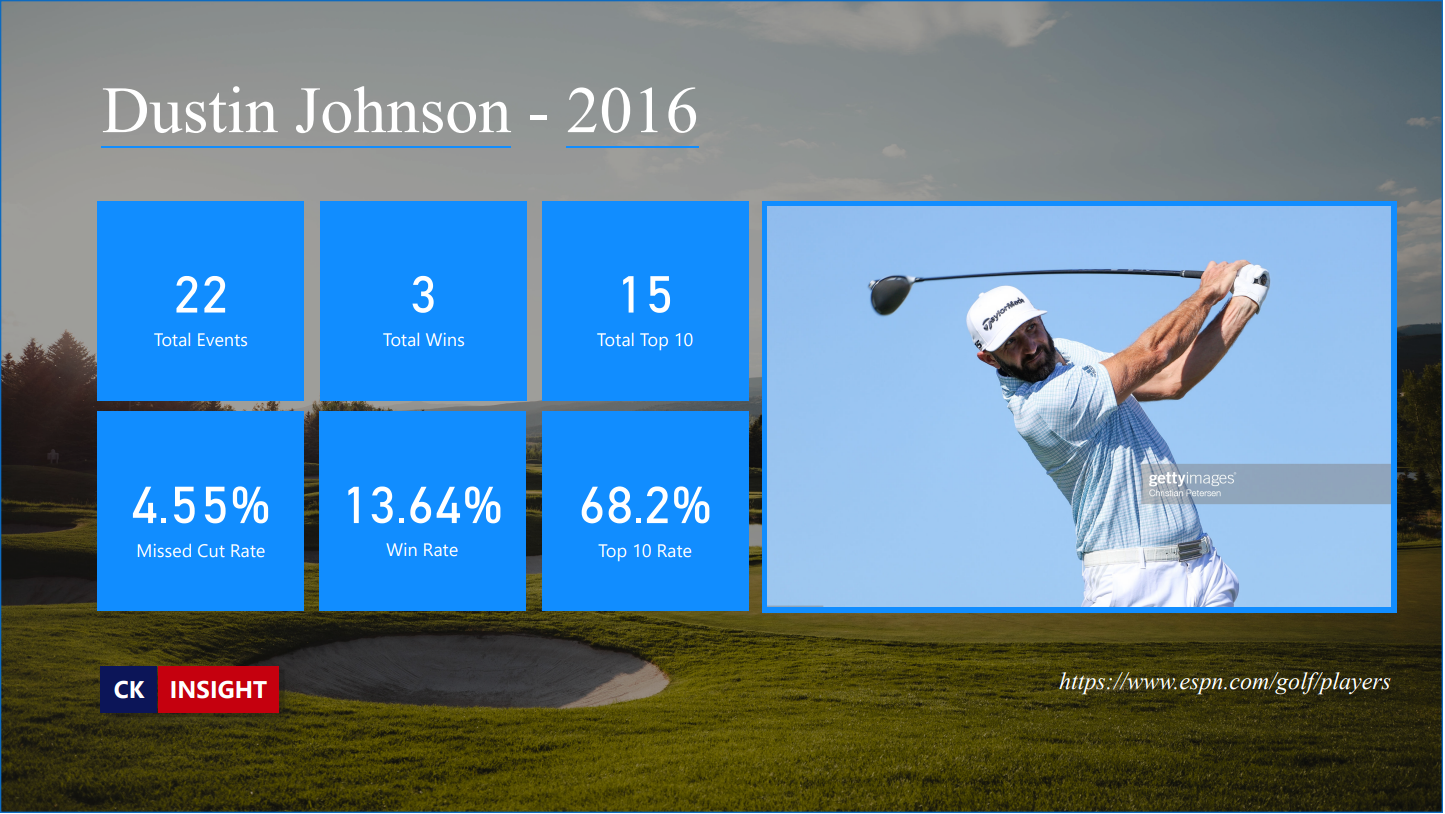
Winners
The best win rate for a long driver was Dustin Johnson in 2016 (AVG 314 Yards) – He entered 22 events and won 3 of them (13.6% Win Rate), 15 Top 10s (68.2%) and only missed the cut once.
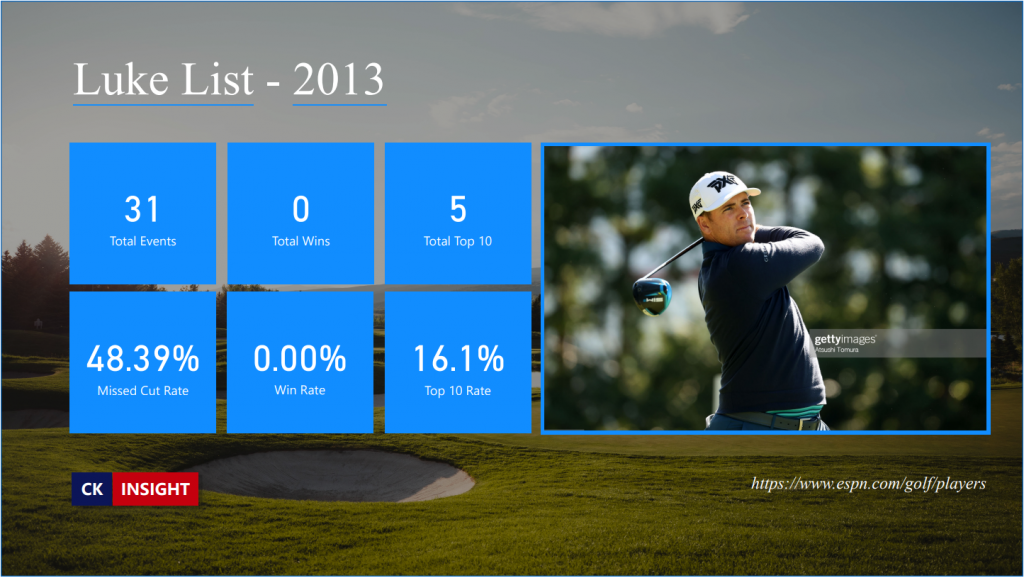
Losers
2013’s longest driver Luke List (me neither) Outdrove the rest of the field be an average of 19 yards – He entered 31 events and finished Top 10 in 5 (16.1%), missed the cut in 15 (48.4%).
Another long driver who failed to win during their long drive year was Rory Mcllroy in 2017