
Makeover Monday is a Tableau challenge, you’re supplied with a dataset and you build a dashboard to present the data. I’ve built football dashboards in the past so this was a great subject to start with. Messi and Ronaldo are two of the sports greatest, and keep getting better.
Designing the Dashboard
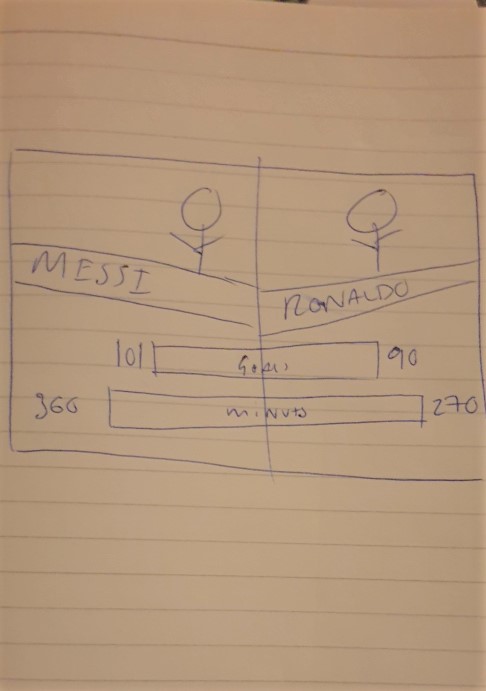
I sketched out my dashboard ideas before turning the computer on, I then added more detail using Google Slides. As you can see below the idea was to mimic the idea of Tops Trumps card games, after the initial sketches I decided that the presentation of the data wasn’t the best.
Version 2.0
The original dashboard wasn’t great comparing stats, so version 2 would be designed to allow easy analysis of the stats. Each player would flank the dashboard and would include basic stats about the player (name, age, place of birth), and display the key for the charts.

Building in Tableau
Now that I had the basic layout sketched, it was time to make the dashboard come to life. Handily #makeovermonday supplies data in an csv format, this makes loading data into Tableau pretty simple. Select the datasource and its a simple as that, I could now use the data to build the dashboard.
I wanted to use a donut chart to present the data. Annoyingly Tableau doesn’t have donut charts as a default chart, to get around this there is a plenty of hacks available on the internet. The hack if found basically involves creating 2 pie charts and overlapping them, you then change the colour of the chart on top and this creates the look of the donut. While this gives the impression of a donut, every time you change the size, you have to teak the look. (I’m not sure why they aren’t standard charts, but the work around does its job)
To create the coloured circles for the player photos I used a pie chart and overlapped the players photo, this gives the player a border and also acts as a key for the charts.
Each chart has a semi-transparent background to make it stand out from the background. Champions League logo was imported as an image and sent to the back of the dashboard, this gives the dashboard a bit more of an identity.
Final Version
